
Time to First Response
Question: How much time passes between when an activity requiring attention is created and the first response?
Overview
The time to first response measures how long it takes for a project or community member to respond to an activity that requires attention, such as a pull request, issue, or email. The first response is often crucial as it signals to contributors that the community is active and engaging. A long delay in response might indicate low community engagement, while a shorter response time can encourage more participation and foster a more active community.
Measuring this metric helps to understand the responsiveness of a project’s community and its overall health. Timely responses can enhance the onboarding experience for new contributors and improve retention. Additionally, fast response times may indicate a higher level of collaboration and engagement in the project, making the project environment more inclusive and welcoming.
Want to Know More?
Data Collection Strategies
- Timestamps: Collect timestamps for when activities (e.g., issues, pull requests, or emails) are created and when the first response is made.
- Activity Tracking: Use version control systems (GitHub, GitLab), mailing lists, or forums to capture activity and response times.
- Exclusion of Automated Responses: Make sure to exclude responses from bots or other automated systems when measuring genuine community engagement.
Filters
- Role of responder, e.g., only count maintainer responses
- Automated responses, e.g., only count replies from real people by filtering bots and other automated replies
- Type of Activity, e.g., issues (see metric Issue Response Time, emails, chat, change requests
Visualizations
Visualizations for the Time to First Response metric may include response time trends for various activity types or community segments.
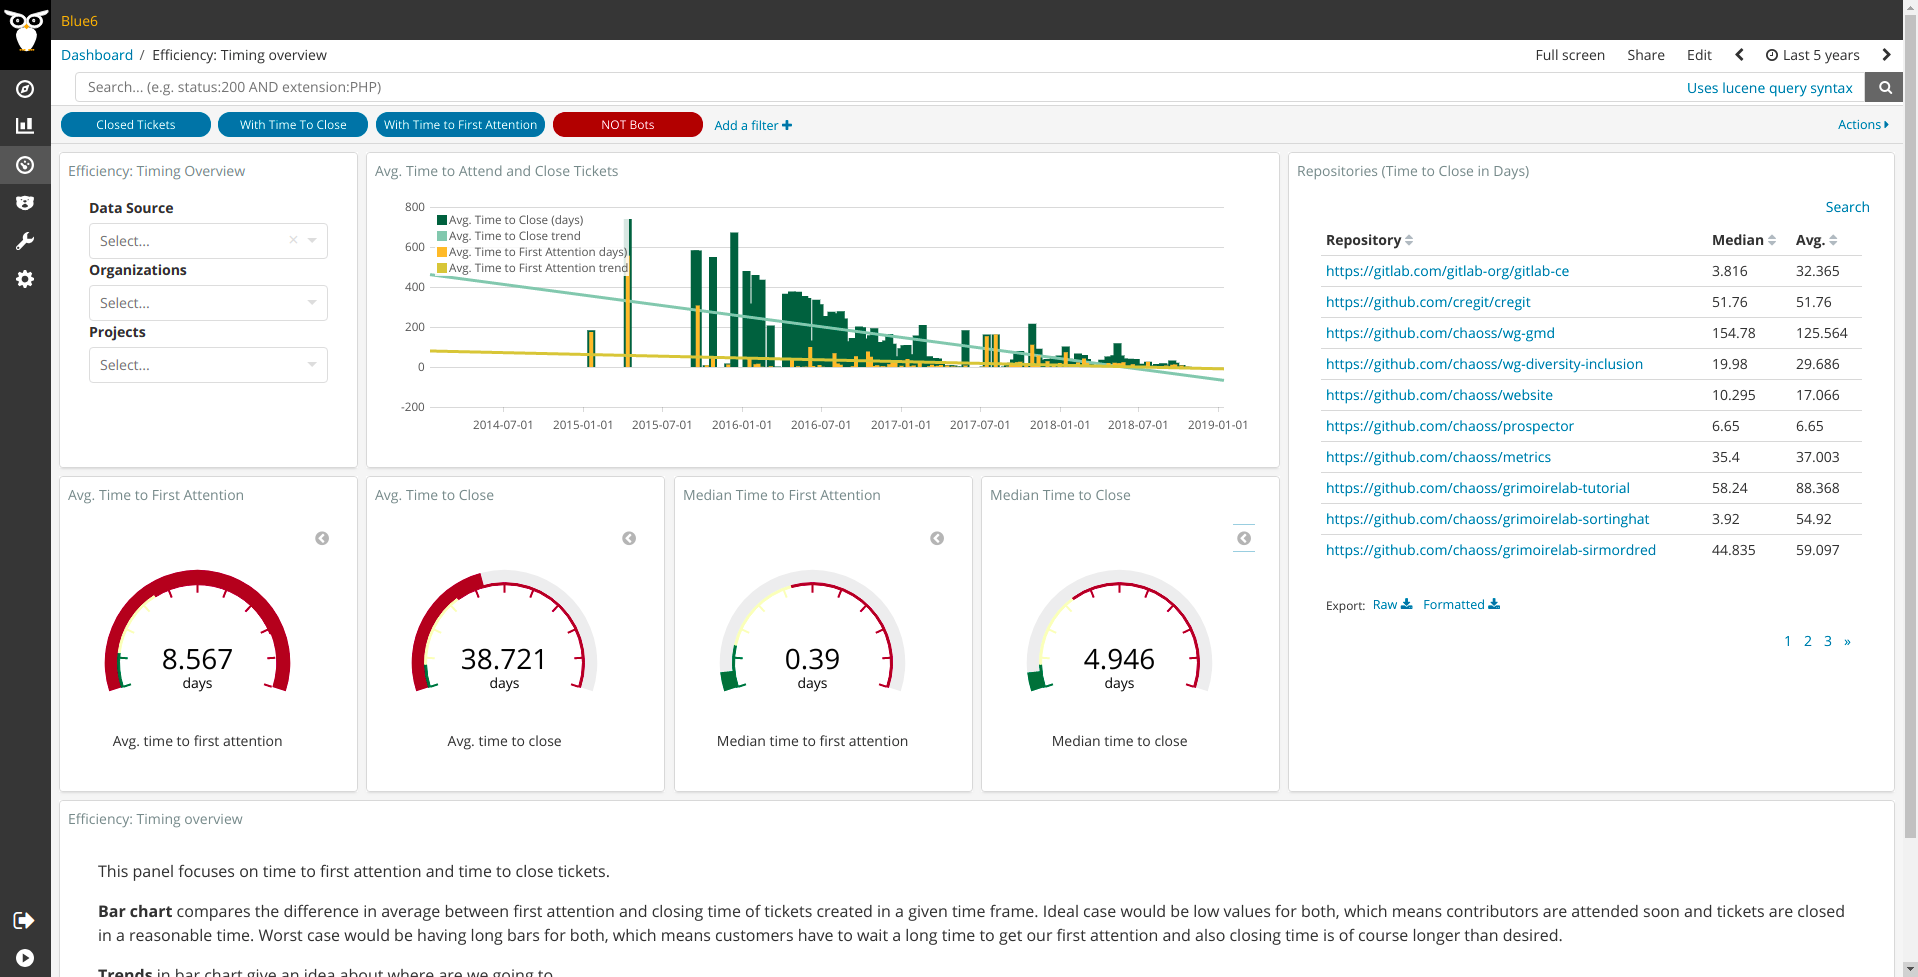 Figure 1: Response times for pull requests across different time periods (GrimoireLab)
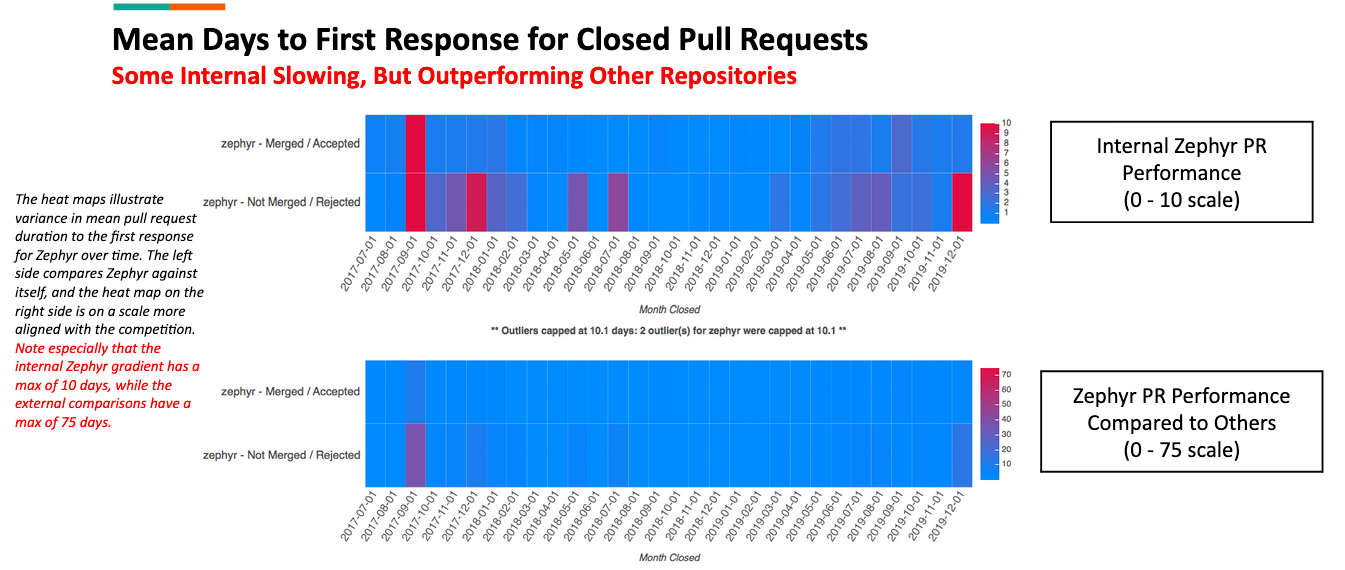 Figure 2: Distribution of time-to-first-response for issues in a project (Augur)
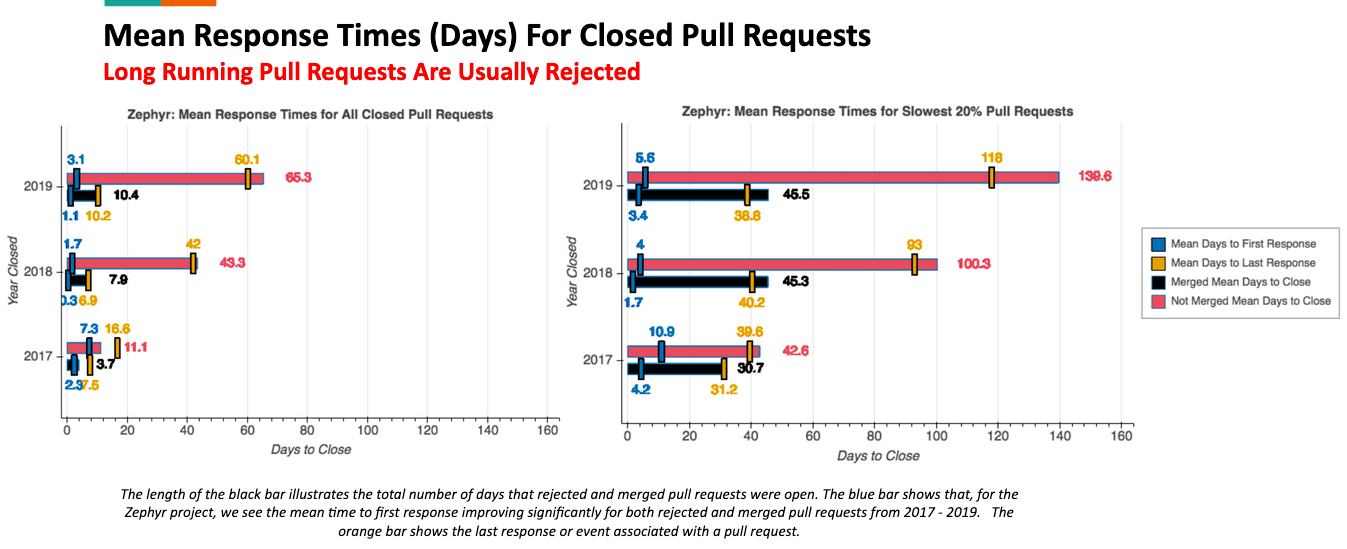 Figure 3: Timeline showing community engagement levels by response time (Augur)
Contributors
- Elizabeth Barron
- Matt Germonprez
- Kevin Lumbard
- Georg J.P. Link
- Sean P. Goggins
- Dawn Foster
- Yigakpoa Samuel
Additional Information
To edit this metric, please submit a Change Request here.
To reference this metric in software or publications, please use this stable URL: https://chaoss.community/?p=3448.
The usage and dissemination of health metrics may lead to privacy violations. Organizations may be exposed to risks. These risks may flow from compliance with the GDPR in the EU, with state law in the US, or with other laws. There may also be contractual risks flowing from terms of service for data providers such as GitHub and GitLab. The usage of metrics must be examined for risk and potential data ethics problems. Please see CHAOSS Data Ethics document for additional guidance.