
Elephant Factor
Question: What is the distribution of work in the community across companies?
Overview
Elephant factor measures the minimum number of companies whose employees contribute a specified percentage of the total commits in a software repository. This metric provides a quantitative indicator of the project's dependency on a small set of corporate contributors. A high elephant factor suggests that the project is heavily reliant on a few key contributors, making it more vulnerable to disruptions or changes in their involvement or a lack of diversity among contributors, as a small number of companies dominate the project. While low elephant factor indicates a more distributed contributor base, which can enhance the project's resilience and longevity or could indicate a more diverse and inclusive community. Elephant Factor provides an easy-to-consume indication of the minimum number of companies performing a certain percentage (i.e. 50%) of the work. The parameterized filter should reasonably be different for a project to which 1,000 organizations contribute than one to which, perhaps 10 contribute. The origin of the term "elephant factor" is not clearly delineated in the literature, though it may arise out of the general identification of software sustainability as a critical non-functional software requirement by Venters et al (2014).
Want to Know More?
Click to read more about this metric.
-
Elephant Factor Formula The formula for elephant factor is a percentage calculation -it will be our threshold- followed by adding up each company's contributions sorted in decreasing order until we reach the threshold. If we have 8 organizations who each contribute the following number of commits to a project:
1000, 202, 90, 33, 332, 343, 42, 433, then we can determine the elephant factor by first identifying the 50% of total commits for all the companies. -
Summary: 50% of total contributions =
1,237.5, so the elephant factor is2. - Full Solution:
- Arrange the data in descending order:
1000, 433, 343, 332, 202, 90, 42, 33 - Compute the 50% of the total:
(1,000 + 433 + 343 + 332 + 202 + 90 + 42 + 33) * 0.5 = 1,237.5
- Adding up the first two companies in our ranking we get
1,433. - Answer: as
1,433 > 1,237.5, more than the 50% of contributions is performed by only2companies, thus we can say theelephant factor = 2.
- Arrange the data in descending order:
Filters
- Time: Reasonably the Elephant Factor will change if one takes a snapshot of any prior time period, so the elephant factor over the life of a product may misrepresent the current level of organizational diversity supported by the project.
- Repository Group: Many open source projects include multiple repositories, and in some cases examining all of the repositories associated with any given project provides a more complete picture of elephant factor.
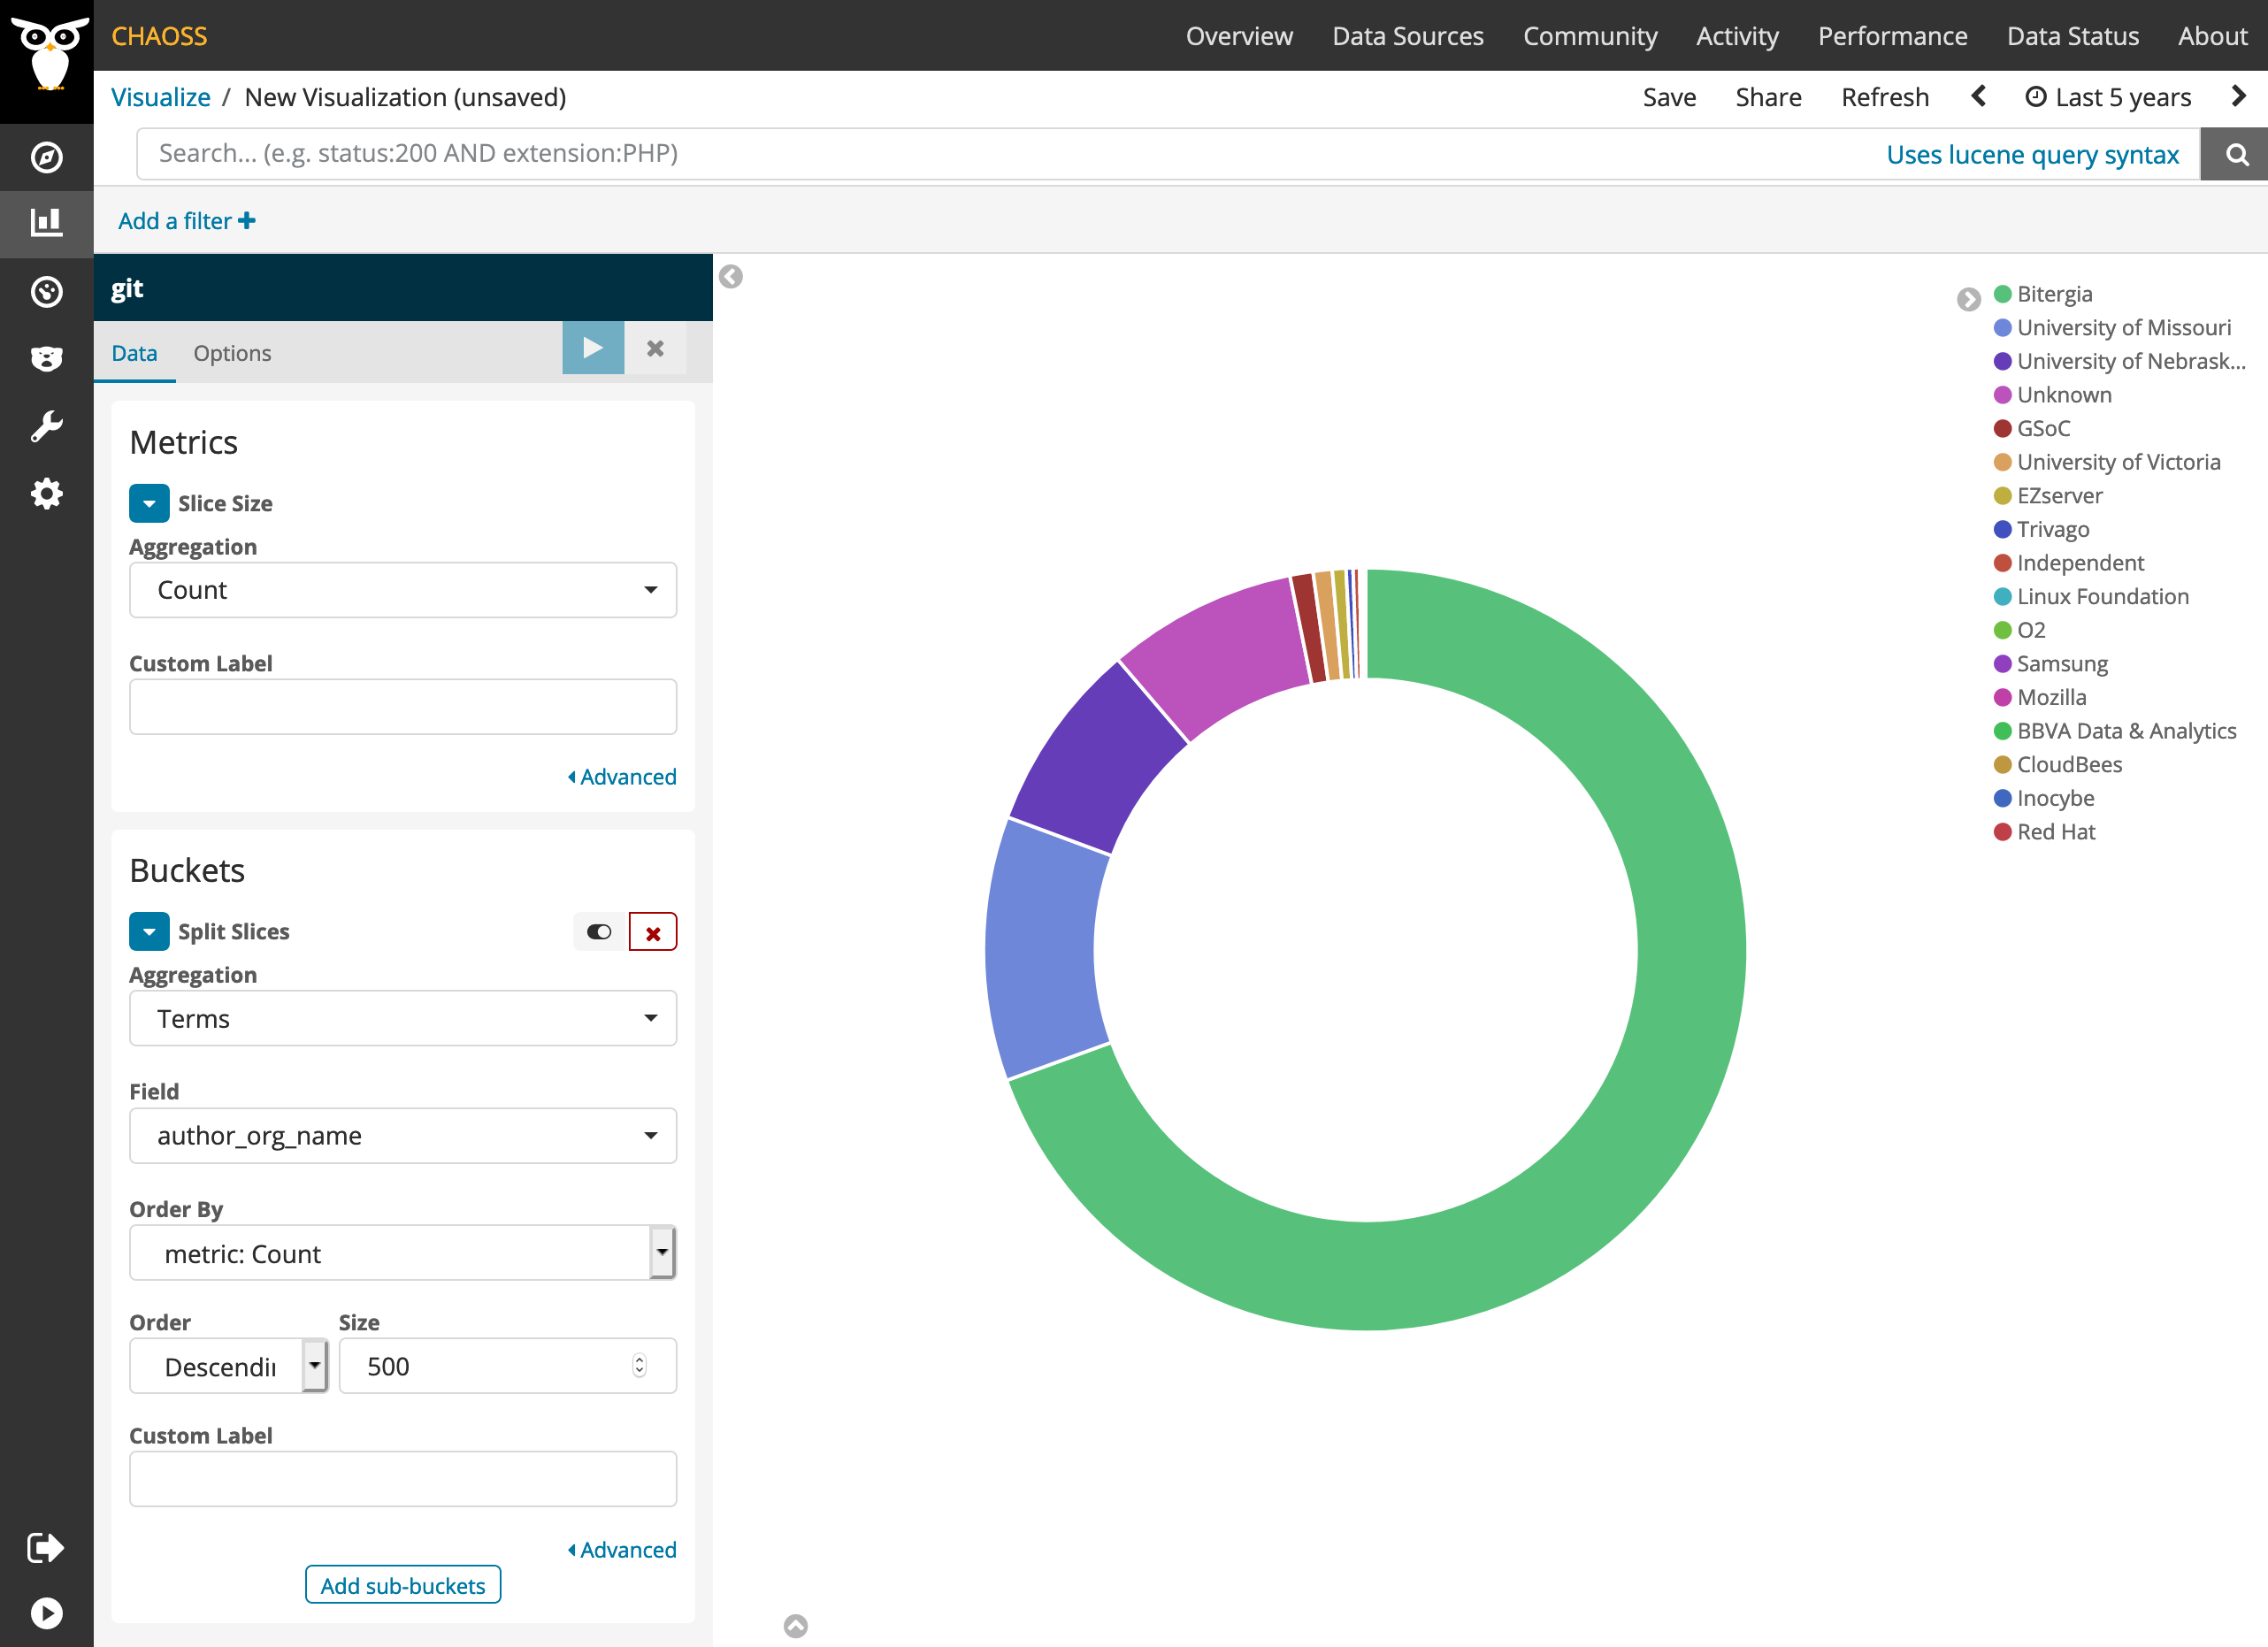
Visualizations
GrimoireLab Sigils panel collection.
References
- Presentation: The Quantitative State of the Open Cloud
- Elephant Factor applied to Eclipse
- Augur
- GrimoireLab
- CHAOSS instance of Bitergia Analytics
- Metrics of the Month: The Elephant Factor
Contributors
- Elizabeth Barron
- Matt Germonprez
- Kevin Lumbard
- Yash Prakash
- Georg Link
- Maalik
- Peculiar C. Umeh
Additional Information
To edit this metric please submit a Change Request here
To reference this metric in software or publications please use this stable URL: https://chaoss.community/?p=3940
The usage and dissemination of health metrics may lead to privacy violations. Organizations may be exposed to risks. These risks may flow from compliance with the GDPR in the EU, with state law in the US, or with other laws. There may also be contractual risks flowing from terms of service for data providers such as GitHub and GitLab. The usage of metrics must be examined for risk and potential data ethics problems. Please see CHAOSS Data Ethics document for additional guidance.