
Collaboration Platform Activity
Question: What is the count of activities across digital collaboration platforms (e.g., GitHub, GitLab, Slack, email) used by a project?
Overview
Open source projects use various digital communication and collaboration platforms such as email, social media, chat applications, and code management technologies like GitHub or GitLab. This metric measures the volume and location of message activity across these platforms, providing insights into where and how collaboration happens in the project.
Understanding where the community interacts helps track engagement, transparency, and project accessibility. This metric is crucial for evaluating communication processes and identifying the most effective channels for community participation.
Want to Know More?
Objectives
The Collaboration Platform Activity metric helps:
- Understand where the community is collaborating and how it communicates.
- Identify the processes followed by each project based on communication logs.
- Demonstrate the level of transparency in project communications.
- Help contributors find the appropriate platform for making contributions and connecting with the project.
- Enable project maintainers to determine the optimal number of communication channels to efficiently share information and engage contributors.
- Identify the lowest-barrier channels for engagement.
- Support other metrics, such as Burstiness, Project Velocity, Activity Dates and Times, and Chat Platform Inclusivity.
Data Collection Strategies
The unit of data collection is the individual activity on a platform. Metadata related to this metric can include:
- Timestamp of the activity
- Sender (user or bot)
- Threaded or non-threaded platform type
- Data collection date
- Platform message identifier
Filters
- Number of people
- Number of messages
- Number of comments on Issues and Change Requests
- Type of channel (mailing list, irc, and so on)
- Activity per day of the week
- Contribution attributions (e.g., people or organizations)
Visualizations
-
Visualization of Platform Activity:
Display the count of platform activities over time.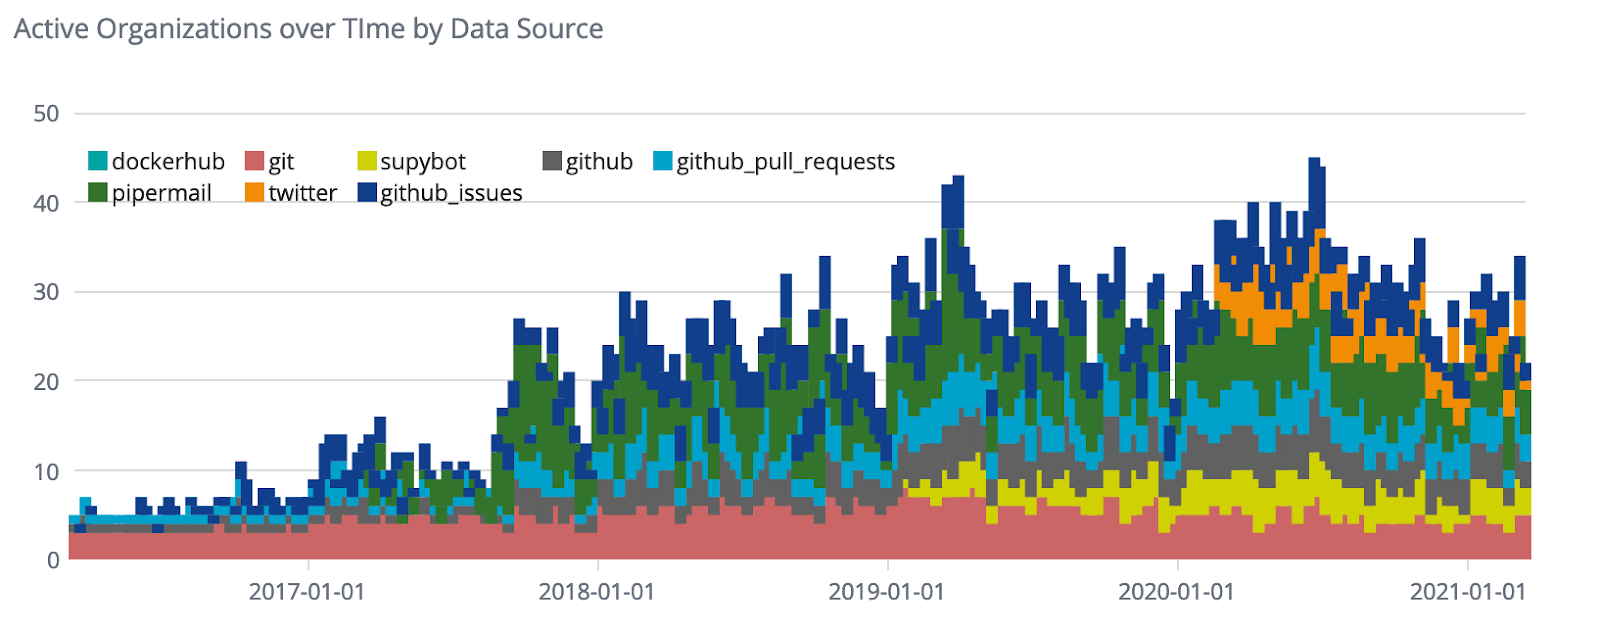
Figure 1: Collaboration platform activity chart (GrimoireLab) - Interactive Dashboards:
GrimoireLab Dashboard Figure 2: GrimoireLab dashboard displaying platform activity metrics (GrimoireLab)
References
Contributors
- Elizabeth Barron
- Sean Goggins
- Matt Germonprez
- Daniel Izquierdo
- Dawn Foster
- Beth Hancock
- Kevin Lumbard
- Vinod Ahuja
- Yigakpoa L. Samuel (Ikpae)
Additional Information
- To edit this metric please submit a Change Request here: https://github.com/chaoss/wg-metrics-development/blob/main/focus-areas/place/collaboration-platform-activity.md
- To reference this metric in software or publications please use this stable URL: https://chaoss.community/?p=3484
The usage and dissemination of health metrics may lead to privacy violations. Organizations may be exposed to risks. These risks may flow from compliance with the GDPR in the EU, with state law in the US, or with other laws. There may also be contractual risks flowing from terms of service for data providers such as GitHub and GitLab. The usage of metrics must be examined for risk and potential data ethics problems. Please see CHAOSS Data Ethics document for additional guidance.