Change Request Closure Ratio
Question: Is the project keeping up with change requests?
Description
This metric evaluates if the project is handling change requests (e.g., pull requests / merge requests) in a timely fashion by measuring the ratio between the total number of open change requests during a time period versus the total number of change requests closed in that same period.
Objectives
Attention to the project’s Change Request Closure Ratio has numerous benefits for open source projects: contributors benefit from getting a decision about their contribution and change requests are less likely to have merge conflicts if they are dealt with more quickly. This metric also provides insight for:
- Understanding whether a project has enough maintainers to keep up with change requests.
- Encouraging maintainers to close change requests that will not be merged, even when this might involve difficult conversations.
- Monitoring long closure times or neglected change requests which may be a barrier to contribution for participants from underrepresented groups.
Implementation
The change request closure ratio is measured by comparing the total number of open change requests during a specified time period with the number of closed change requests during the same time period. More specifically, the ratio is calculated as the number of closed change requests divided by the number of open pull requests during the same time period. Projects that are keeping up with change requests will have a ratio approaching 1, which indicates that the project is closing most or all of their open pull requests.
Filters (optional)
- Date ranges (e.g., past 90 days, past year)
- Automated responses, e.g., only count replies from real people by filtering bots and other automated replies
- Labels
- Type of change request (bug fixes vs. new features)
- Type of close (accepted vs. rejected)
Visualizations (optional)
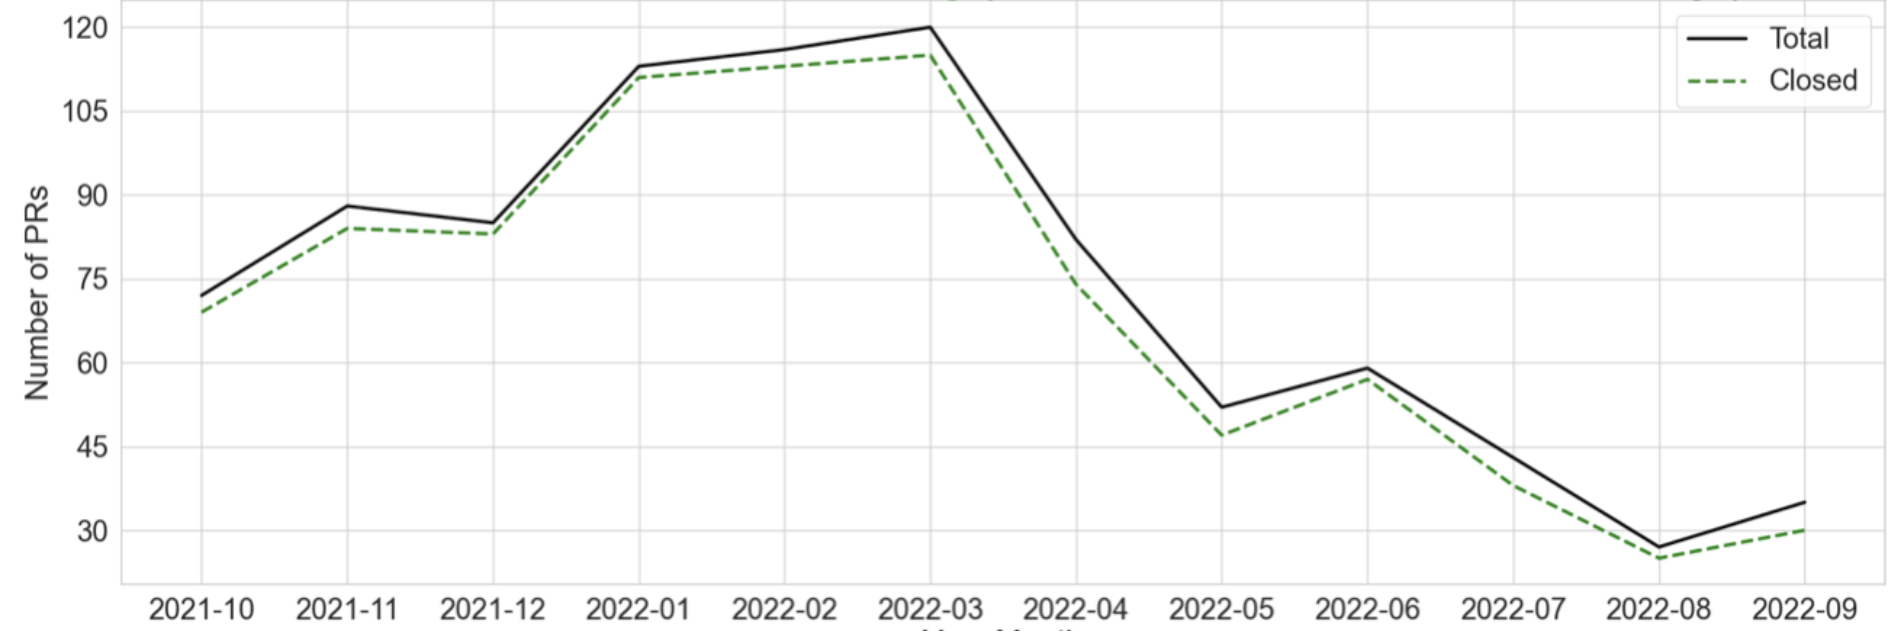
Total vs. Closed Pull Requests: Data from Augur displayed using the Seaborn Python library.

REI Data from GrimoireLab (REI: Review Efficiency Index, defined as the number of closed pull requests divided by the number of open ones in a given period of time. Measures efficiency closing pull requests.)

References
Known Contributors
- Dawn Foster
- Matt Germonprez
- Kevin Lumbard
- Elizabeth Barron
- Yehui Wang
To edit this metric please submit a Change Request here: https://github.com/chaoss/wg-common/blob/main/focus-areas/time/change-request-closure-ratio.md
To reference this metric in software or publications please use this stable URL: https://chaoss.community/?p=4834
The usage and dissemination of health metrics may lead to privacy violations. Organizations may be exposed to risks. These risks may flow from compliance with the GDPR in the EU, with state law in the US, or with other laws. There may also be contractual risks flowing from terms of service for data providers such as GitHub and GitLab. The usage of metrics must be examined for risk and potential data ethics problems. Please see CHAOSS Data Ethics document for additional guidance.
