
Issues Active
Question: How many issues were active during a certain period?
Description
Issues are defined as in Issues New. Issues showing some activity are those that had some comment, or some change in state (including closing the issue), during a certain period.
For example, in GitHub Issues, a comment, a new tag, or the action of closing an issue, is considered as a sign of activity.
Objectives
- Volume of active issues in a project. Active issues are a proxy for the activity in a project. By counting active issues related to code in the set of repositories corresponding to a project, you can have an idea of the overall activity in working with issues in that project. Of course, this metric is not the only one that should be used to track volume of coding activity.
Filters
- By actor (submitter, commenter, closer). Requires merging identities corresponding to the same author.
- By groups of actors (employer, gender... for each of the actors). Requires actor grouping, and likely, actor merging.
- By ratio of active issues over total number of issues during that period.
- By start and finish date of the period during which issues are considered.
- By total number of active issues during the period.
Visualizations
- Count per period over time
- Ratio per period over time
These could be grouped by applying the previously defined filters. These could be represented as bar charts, with time running in the X axis. Each bar would represent proposals to change the code during a certain period (eg, a month).
Tools Providing the Metric
-
GrimoireLab provides data for computing a metric close to the one described in this page for GitHub Issues, GitLab issues, Jira, Bugzilla and Redmine. In terms of the metric, GrimoireLab data have only the date of the last update of each item, which limits computing this metric to time ranges ending on the current date.
- Depending on the source API, the definition of what is considered an update on the issue could vary. GrimoireLab uses
metadata__updated_onto store latest issue update, please check Perceval documentation to look for the specific API field being used in each case and understand its limitations, if any. - Currently, there is no dashboard showing this in action. Nevertheless, it is easy to build a visualization that shows the number uses which last activity occurred at some point between a date and current date (we'll do it for GitHub Issues here).
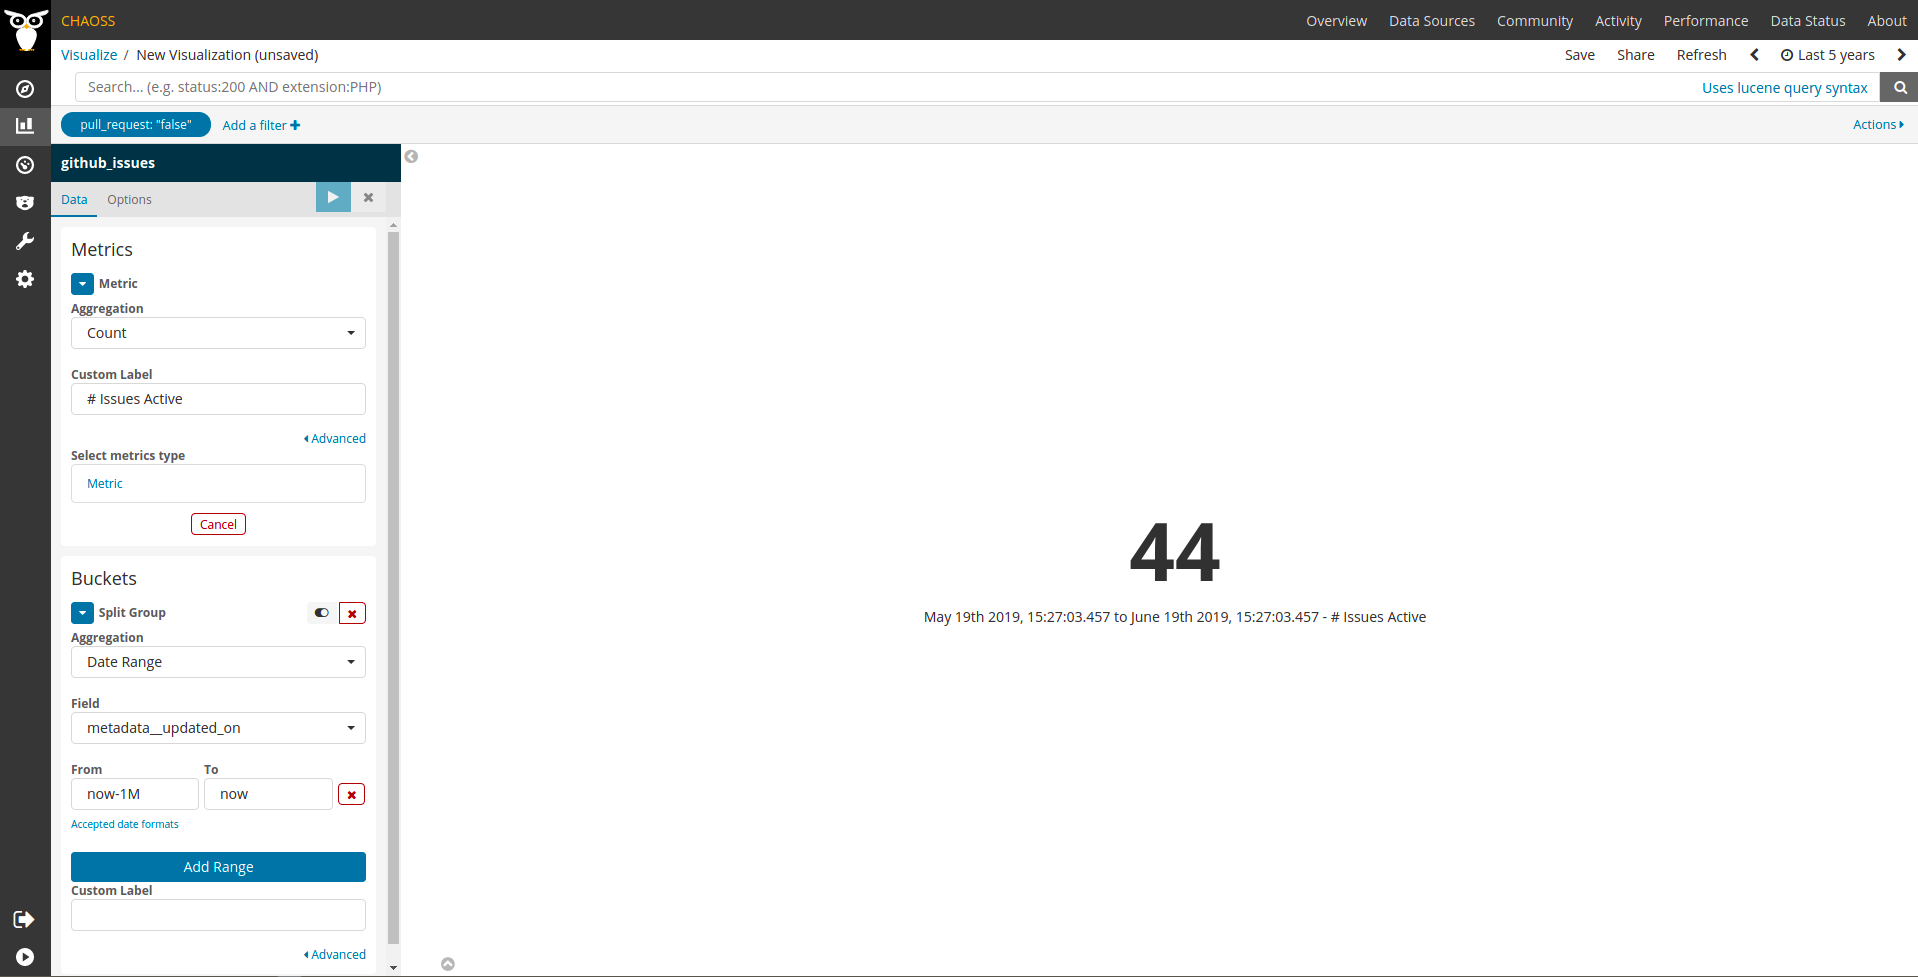
- Add a sample visualization to any GrimoreLab Kibiter dashboard following these instructions:
- Create a new
Metricvisualization. - Select the
github_issuesindex. - Filter:
pull_requestisfalse. - Metric:
CountAggregation,# Issues ActiveCustom Label. - Buckets:
Date RangeAggregation,metadata__updated_onField,now-1MFrom (or whatever interval may fit your needs),nowTo, leave Custom Label empty to see the specific dates in the legend. - Have a look at the time picker on the top right corner to make sure it is set to include the whole story of the data so we are not excluding any item based on its creation date.
- Example screenshot:
 .
. - Depending on the source API, the definition of what is considered an update on the issue could vary. GrimoireLab uses
Data Collection Strategies
Specific description: GitHub
In the case of GitHub, active issues are defined as "issues which get a comment, a change in tags, a change in assigned person, or are closed".
Specific description: GitLab
In the case of GitLab, active issues are defined as "issues which get a comment, a change in tags, a change in assigned person, or are closed".
Specific description: Jira
In the case of Jira, active issues are defined as "issues which get a comment, a change in state, a change in assigned person, or are closed".
Specific description: Bugzilla
In the case of Bugzilla, active issues are defined as "bug reports which get a comment, a change in state, a change in assigned person, or are closed".
To edit this metric please submit a Change Request here: https://github.com/chaoss/wg-evolution/blob/main/focus-areas/issue-resolution/issues-active.md
To reference this metric in software or publications please use this stable URL: https://chaoss.community/?p=3632
The usage and dissemination of health metrics may lead to privacy violations. Organizations may be exposed to risks. These risks may flow from compliance with the GDPR in the EU, with state law in the US, or with other laws. There may also be contractual risks flowing from terms of service for data providers such as GitHub and GitLab. The usage of metrics must be examined for risk and potential data ethics problems. Please see CHAOSS Data Ethics document for additional guidance.