
Starter Project Health Metrics Model
Why It Matters
Measuring open source project health can be difficult because there are so many metrics that could be used. As a result, people often struggle to get started with measuring project health in a way that allows them to draw meaningful conclusions without becoming overwhelmed. Measuring key aspects of project health is an important first step toward understanding how an open source project can be improved and deciding where to focus improvement efforts. It’s important to note that not every metric is appropriate for every project as described in more detail in the Data Insights section below.
This metrics model is designed to help people get started with four key project health metrics that they can expand on and customize to meet their unique needs later.
User Stories
- As an OSPO, I want to help our open source contributors improve the health of open source projects driven from within our organization.
- As a contributor, I want to know where I can focus my efforts to help make the project healthier and more successful.
Metrics in the Metrics Model
- Time to First Response Determine the amount of time between when an activity was opened (e.g. Issue or Change Request) and when it received the first response from a human.
-
Change Request Closure Ratio Measure the ratio between the total number of open change requests during a time period versus the total number of change requests closed in that same period.
-
Contributor Absence Factor Determine the smallest number of people that make 50% of contributions
- Release Frequency Determine the frequency of project releases (including point releases with bug fixes)
Data Insights
Background of the Investigated Context
VMware has many open source project repositories spread out across a few dozen separate GitHub organizations, so having a scalable approach to measuring project health was really important. Our OSPO needed metrics that were simple enough that absolutely anyone within the organization could easily use them to make decisions about where a project is doing well and what could be improved without any training required.
We selected four basic measurements that could be used as a way for OSPO to quickly assess project health at a very basic level. We see these metrics as a starting point for projects with the expectation that individual projects should develop additional metrics to better understand other aspects of project health that are important for their specific needs.
Insights Drawn from the Metrics Model
When looking at project health, it’s important to remember that every project is a little different, so it’s important to interpret the metrics in light of a project’s needs. Because every project is different, we do not compare projects against each other, but instead, we expect teams to use their metrics to make improvements and become as healthy as possible. As such, the insights drawn are on a per project level with the insights below as examples from individual projects.
Even when investigating a project, the different repositories may function a bit differently. For example, repositories that maintain project governance documents may function differently from repositories that maintain software components.
It is also important to keep in mind that automation and bot activity can influence the usefulness of several metrics in this model, in particular Time to First Response and Change Request Closure Ratio. These metrics are only applicable when these activities are primarily driven by humans, not automated responses. Likewise, the Release Frequency metric depends on whether / how releases are published, since informational repositories might not have any releases at all, and some projects might make releases in various places (e.g., GitHub, PyPI).
Metric Specific Insights Drawn from the Metrics Model
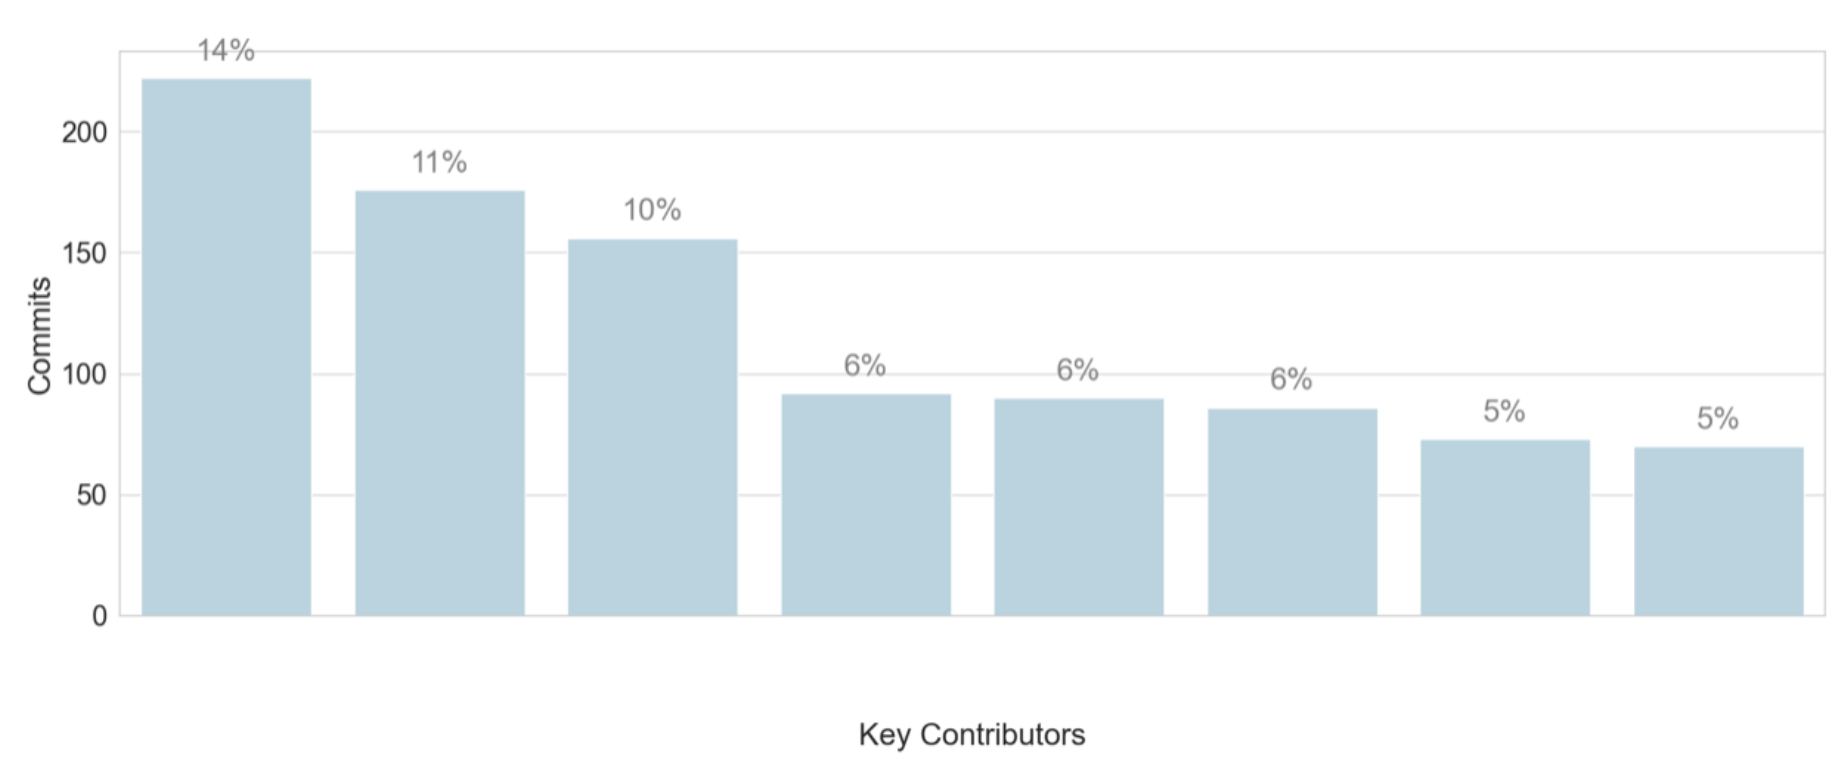
Contributor Absence Factor
In this example, the contributor absence factor is 5, since that is the smallest number of people within the community who make up 50% of the commits, so this project would be likely to continue with minimal interruption if a couple of people suddenly left the project.
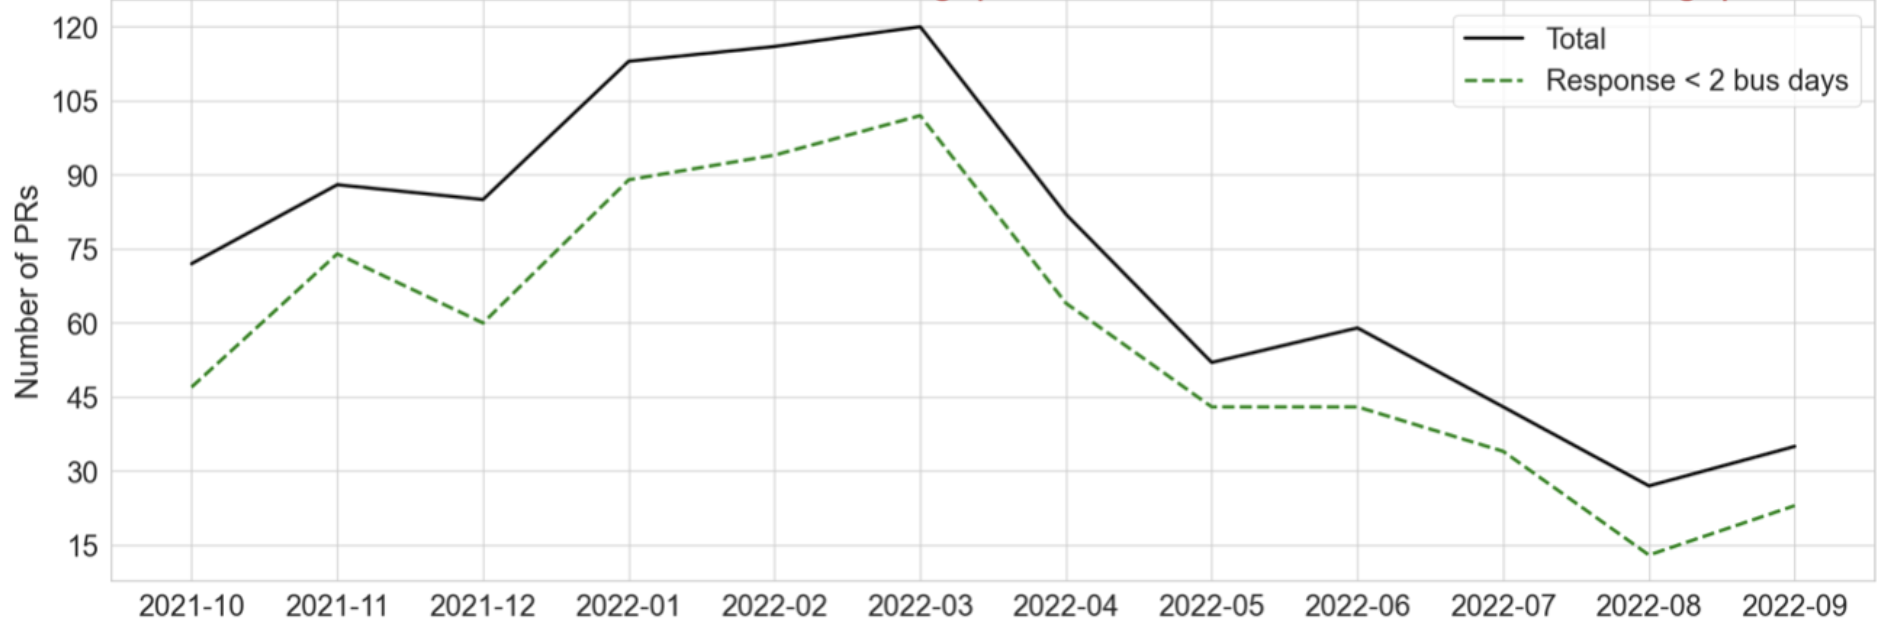
Time to First Response
Contributors can become discouraged when they don’t receive a timely response to a contribution. Our internal guideline for projects is that every PR should receive a response from a human within two business days, so the top line is the total number of PRs and the dotted green line below it shows the PRs that were responded to within two business days. What I look for here is that those lines should be as close together as possible without any huge gaps. You can see in this case that there was a bit of a gap, but you can also see where halfway through this time they’ve improved their time to first response, so it’s important not just to look at the numbers, but also at the trends.
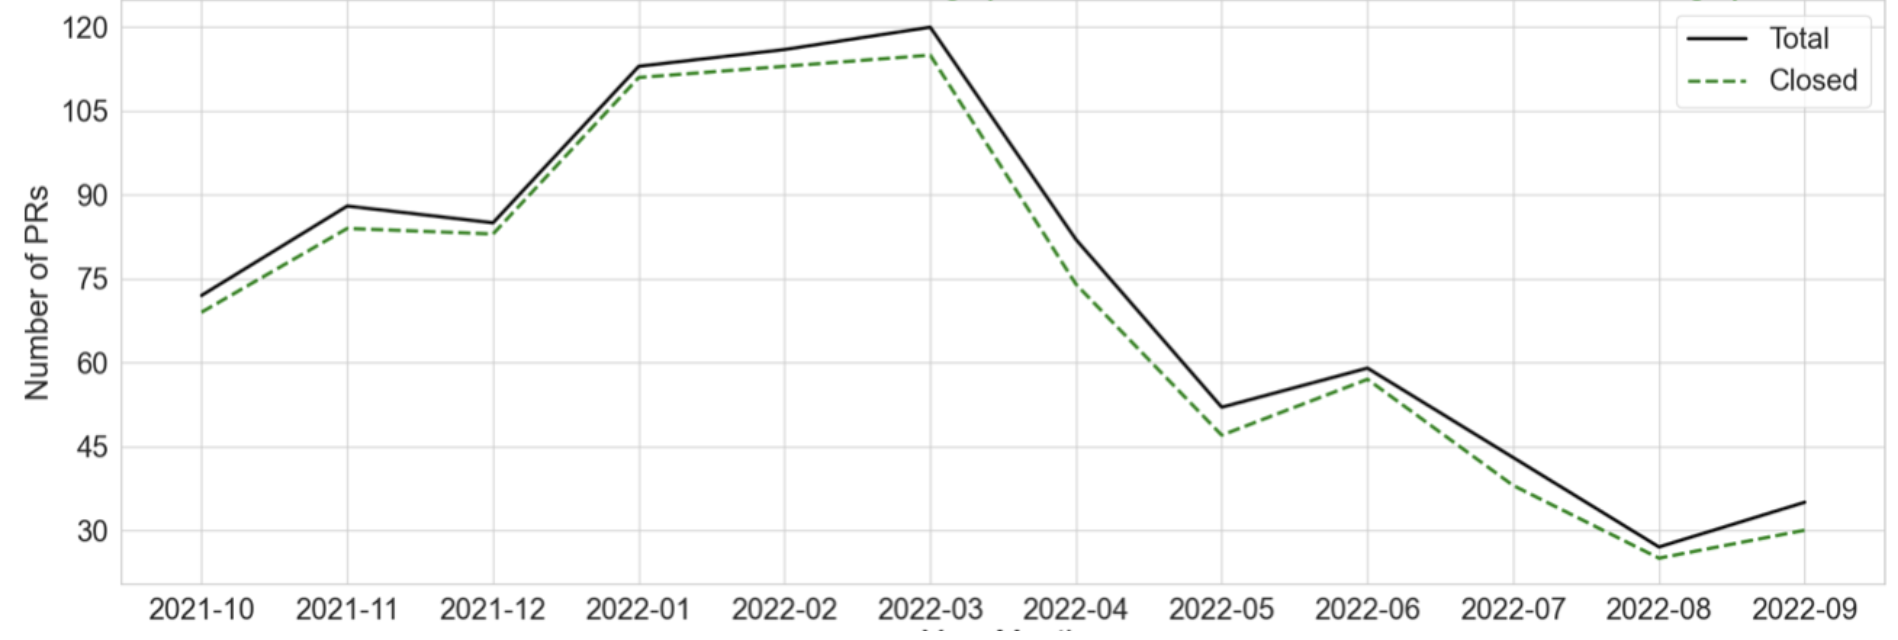
Change Request Closure Ratio
It is important to keep up with PRs and resolve them in a timely manner so that contributors can get a timely resolution on their contributions. This slide shows the same black line for total pull requests and the dotted green line shows closed PRs, so either merged or closed without merge. In this case, the project is consistently doing a good job of closing PRs without falling behind.
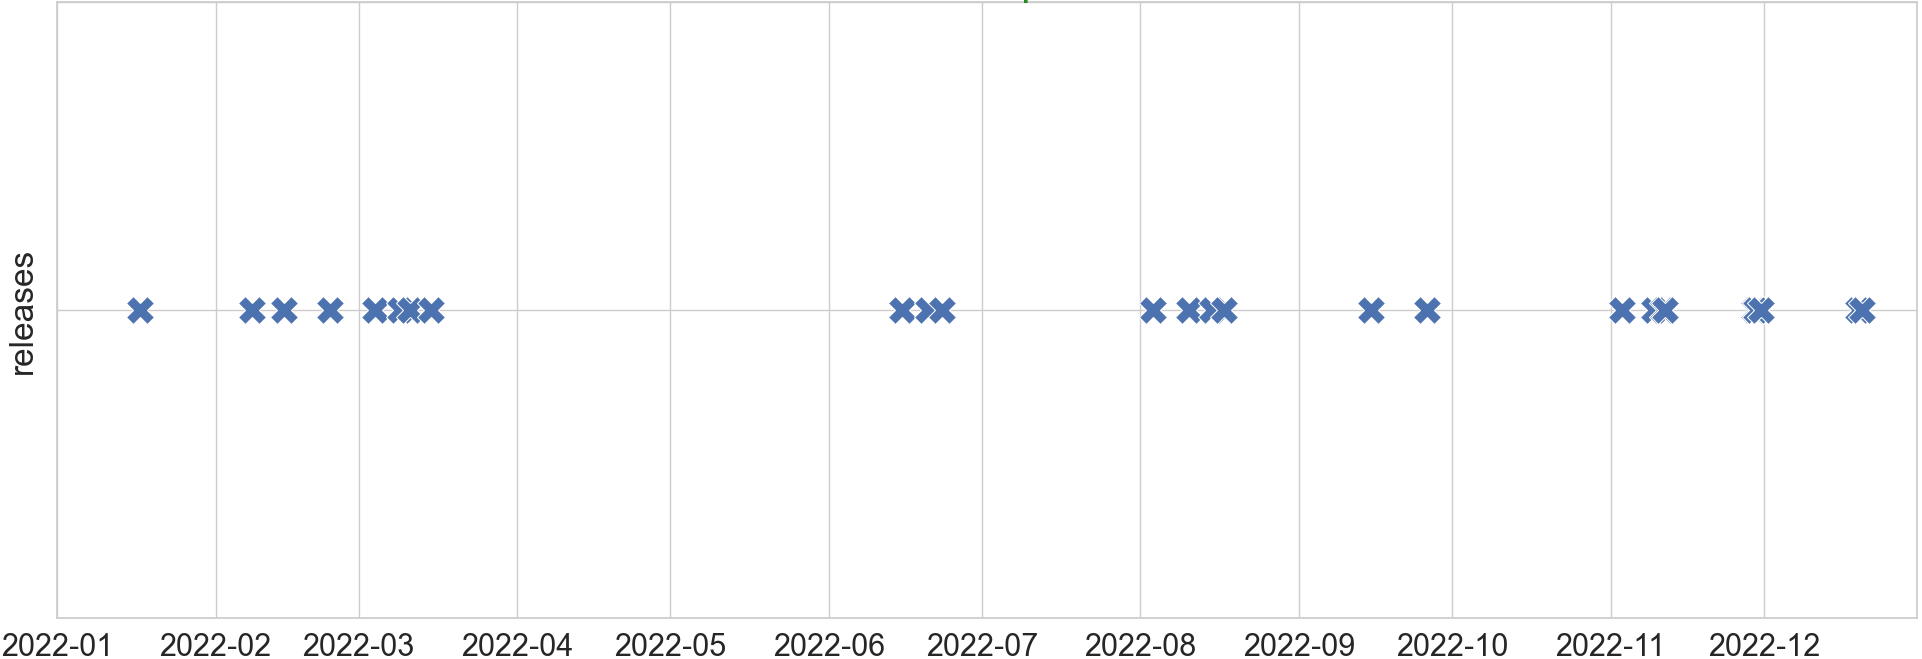
Release Frequency
It’s critical that security updates, bug fixes, and new features are released in a timely fashion. When looking at release cadence, it’s important to include not just the big releases, but also all of the tiny point releases, since urgent security fixes are usually released outside of the major releases. In this example, the period in the middle where the project went about 3 months without a release could potentially be an issue if there were any security concerns, but the rest of the year looks pretty good. Keep in mind that interpreting this metric can be challenging because different types of projects and different situations can impact whether the project needs to have a more frequent or less frequent release cadence. Having a consistent release frequency can indicate a more stable or mature project.
References
Contributors
- Dawn Foster
- Yehui Wang
- Kevin Lumbard
- Sean Goggins
- Matt Germonprez
- Vinod Ahuja
- Elizabeth Barron
- Sophia Vargas
To reference this metric in software or publications please use this stable URL: https://chaoss.community/?p=4769