
Community Activity
Why It Matters
Community Activity is used to describe how active an open source community is.
In order for an open source project to be sustainable, it must continue to be maintained and improved following its initial release. Community Activity describes how much work is being done on a project over time. High levels of community activity may indicate that a project is sustainable and low levels of community activity may indicate that a project is at risk.
User Stories
- As a community manager, I want to know how active the projects I manage are.
- As a community manager, I want to investigate increases and decreases of community activity and what the root cause (good or bad reasons) may be in these changes.
- As a community manager, I hope there are simple ways that would help me quickly identify how active the projects which I manage.
- As an OSPO or a program manager from a company, I want to collaborate with active communities, which may indicate that bug fixes and feature requirements could be solved efficiently. This is especially important, when I have multiple projects to choose from.
- As a contributor, I want to join a community which is more active, because I may get more support and the value I create is more visible.
Related Metrics Models
- Collaboration Development Index Model
- Community Service and Support Model
- Organization Activity Model: A metrics model to measure organazation activity.
- Contributor Persona Model
Metrics in the Metrics Model
- Contributor Count
- Description: The number of active code commit authors, pr authors, review participants, issue authors, and issue comments participants over a certain period of time.
- Objectives: Open source projects are comprised of a number of different contributors. Recognizing all contributors to a project is important in knowing who is helping with such activities as code development, event planning, and marketing efforts.
- Implementation: $X=|\cup{A_i}|$.$A_i$=a contributor who is active over a certain period of time.
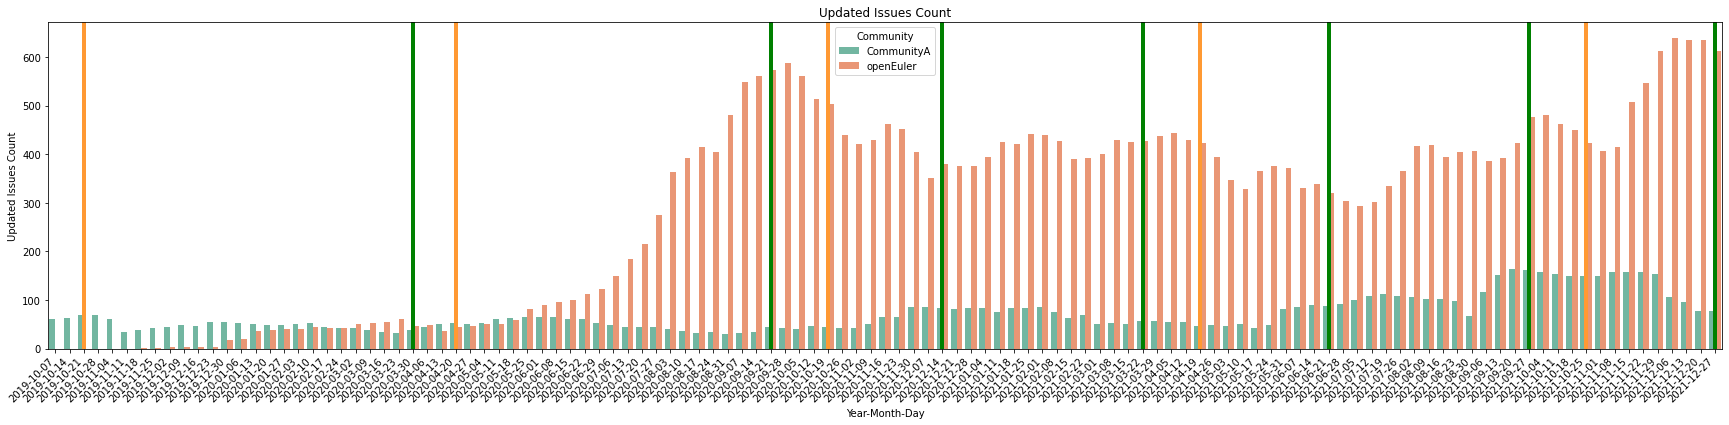
- Updated Issues Count
- Description: The number of issues updated over a certain period of time.
- Objectives:
- Implementation: $X=A$, $A$=The number of issues updated over a certain period of time.
- Recent Releases Count
- Description: The number of releases over a certain period of time.
- Objectives:
- Implementation: $X=A$, $A$=The number of releases over a certain period of time.
- Updated Since
- Description: The average time per repository since the repository was last updated.
- Objectives:
- Implementation: $X=\frac{\sum A_i }{B}$, $A_i$=The time of a repository since it was last updated, B=The number of repositories.
- Code Review Count
- Description: The average number of review comments per pull request created over a certain period of time.
- Objectives:
- To understand the nature of change request review practice within a repository, and across a collection of repositories.
- Change Request Reviews can help inform the quality of the software and the efficiency of development.
- Examining change request review processes and timeliness over time is helpful for characterizing the evolution of an open source software project.
- Exploration of Change Requests Reviews along with demographics of participants may highlight issues of DEI in a projects formal review process.
- Implementation: $X=\frac{A}{B}$, $A$=The number of review comments over a certain period of time, B=The number of pull requests over a certain period of time.
- Organization Count
- Description: The number of organizations to which active code contributors belong over a certain period of time. Objectives:
- Implementation: $X=A$, $A$=The number of organizations to which active code contributors belong over a certain period of time.
- Commit Frequency
- Description: The average number of commits per week over a certain period of time.
- Objectives: Volume of coding activity. Code changes commits are a proxy for the activity in a project. By counting the code changes commits in the set of repositories corresponding to a project, you can have an idea of the overall coding activity in that project. Of course, this metric is not the only one that should be used to track volume of coding activity.
- Implementation: $X=\frac{A}{B}$, $A$=The number of commits over a certain period of time, B=The number of weeks over a certain period of time.
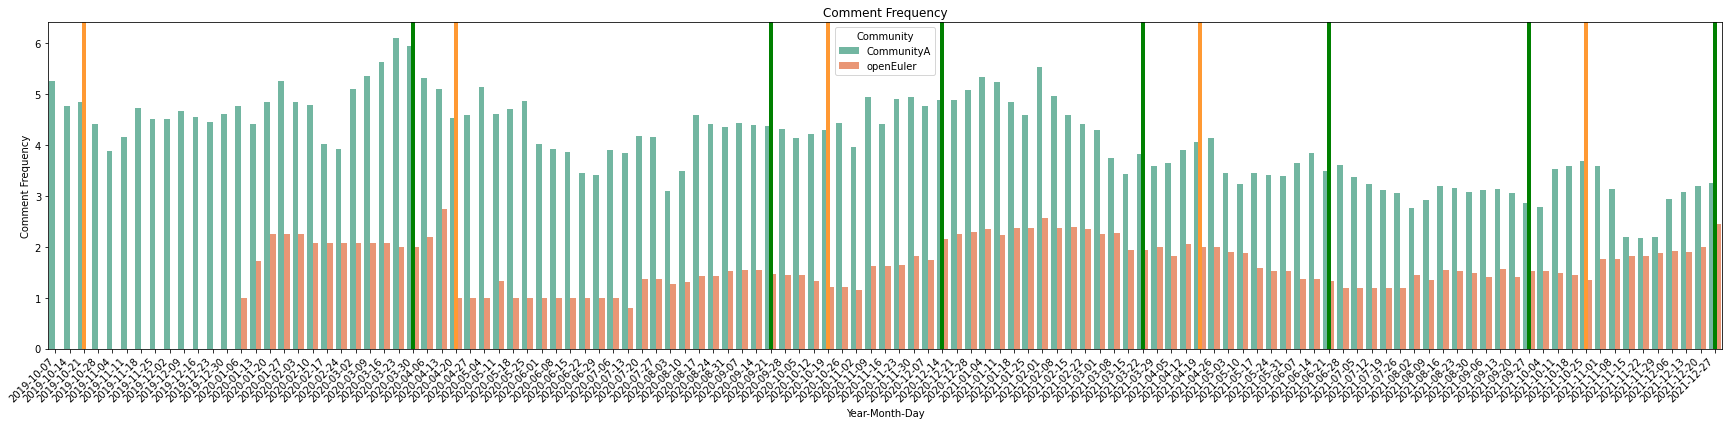
- Issue Comment Frequency
- Description: The average number of comments per issue created over a certain period of time.
- Objectives:
- Implementation: $X=\frac{A}{B}$, $A$=The number of comments over a certain period of time, B=The number of issues over a certain period of time.
- Maintainer Count
- Description: The average number of maintainers per repository.
- Objectives:
- Implementation: $X=\frac{A}{B}$, $A$=The number of maintainers, B=The number of repositories.
- Meeting Count
- Description: The number of meetings over a certain period of time.
- Objectives:
- Implementation: $X=A$,$A$=The number of meetings over a certain period of time.
- Meeting Attendee Count
- Description: The number of attendees per meeting over a certain period of time.
- Objectives:
- Implementation: $X=\frac{\sum A_i}{B}$, $A_i$=The number of attendees of a meeting over a certain period of time, B=The number of meetings over a certain period of time.
Data Insights
Background of the Investigated Context
We chose two communities to evaluate the effectiveness of the activity metric model. We anonymized these two communities, so as to not pass judgment on which community is better. In this example, we simply turn results into insights and provide a comparison of two communities to better understand the metric model.
Both communities are Linux OS distribution communities, including 10,000+ packages, we selected 200 repositories as our sample data source which are core basic packages. Community B has been running for more than 10 years, Community A just created 2 years ago. (Confirmed with Community A, we could publish its name - openEuler)
For the detailed the implementations, you can refer to community_activity.ipynb
Insights Drawn from the Metrics Model
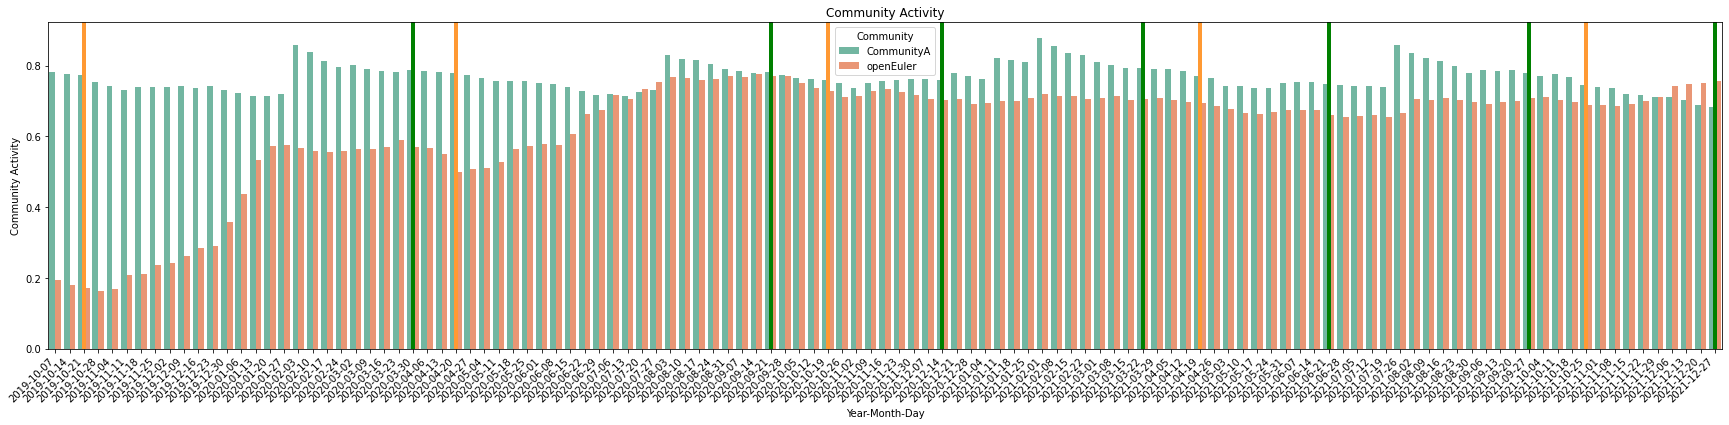
We counted metric model values every week, with vertical lines representing version release dates. We can see that Community B's score is very stable, with an obvious pattern together with version release dates. Community A, as a young community, shows fast growth at the beginning, even exceeding Community B at some points, but there is no obvious pattern. In order to get deeper insights, we needed to check the result of each metric.
Metric Specific Insights Drawn from the Metrics Model
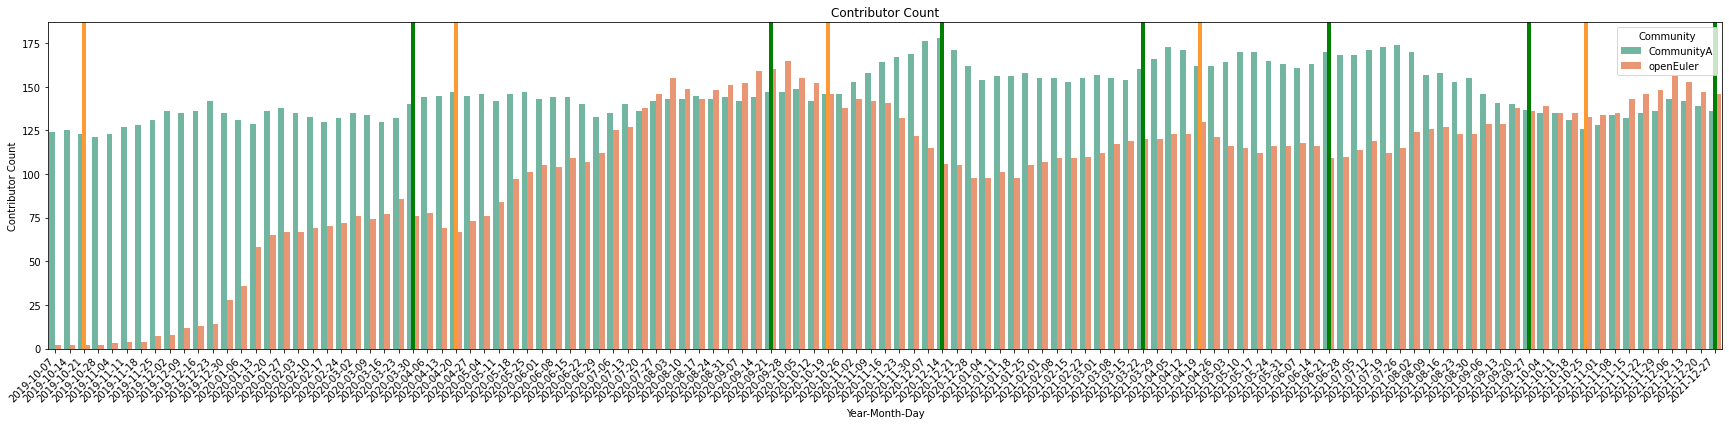
contributor_count
The number of contributors (engaged these 200 repository contributions) in Community B is very stable, Community A shows a surge, which means it successfully attracted many new contributors.
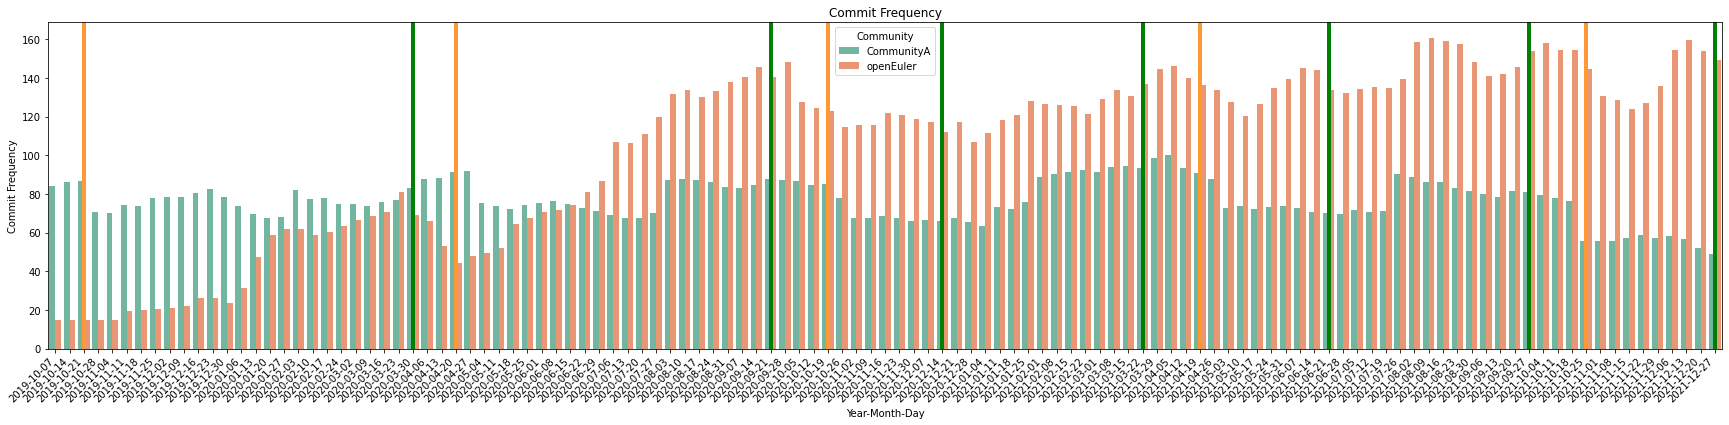
commit_frequency
The result of Commit Frequency shows high relevance with contributor count. We found that value waves pattern of Community B have the same frequency with metric model overall score.
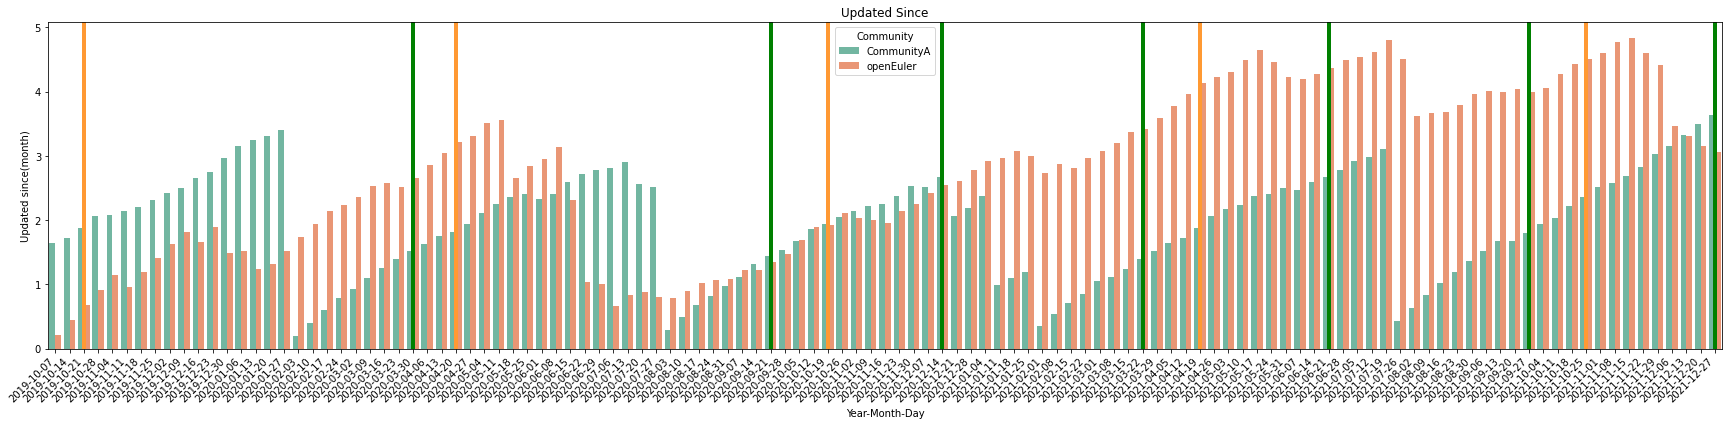
update_since
Project B shows an obvious triangular wave pattern, you would find that almost all the repositories have been maintained before each version was released. However, Project A doesn’t show such capability.
comment_frequency
For each single issue, Community A has approximately 5 comments andthe number is very stable. After investigation, we found that each repository in Community A has a stable group of contributors, they always provide support, and the discuss issue-related topics.
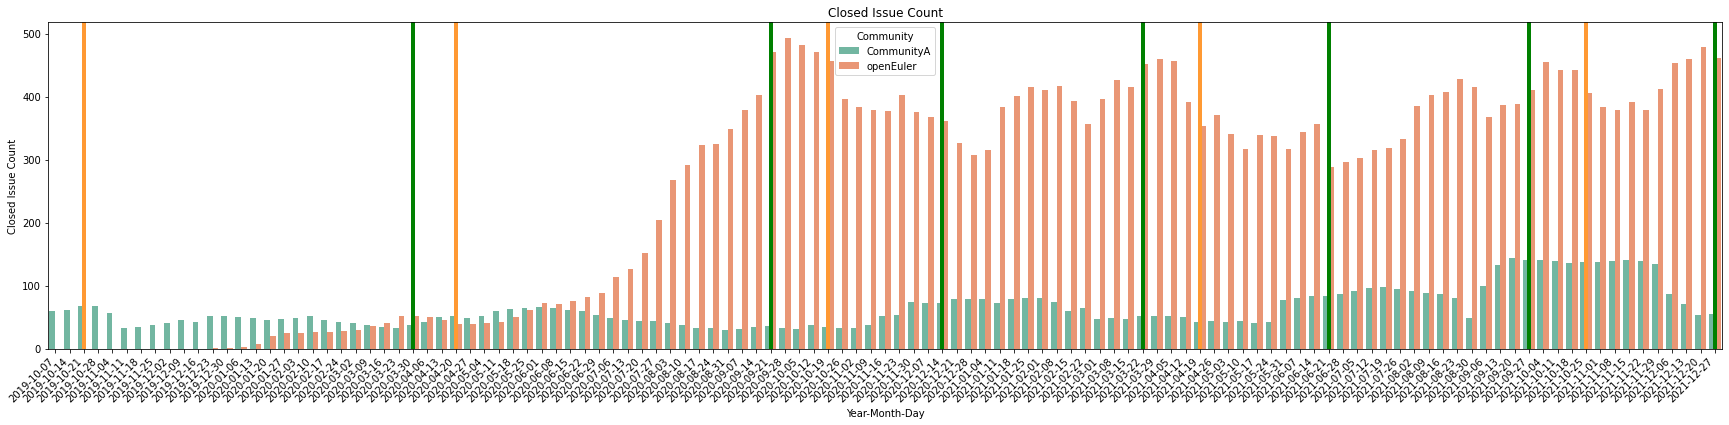
issue handling
We analyzed close_issue_count and update_issue_count together, because they had a strong correlation that was reflected by the figure directly. Higher counts of issue handling indicates high contributor involvement.
References
Contributors
- Yehui Wang
- Jun Zhong
- Chenqi Shan
- Matt Germonprez
- Kevin Lumbard
- Vinod Ahuja
- Hongyun Chen
- Singidi Anish Reddy
To reference this metric in software or publications please use this stable URL: https://chaoss.community/?p=4736