
Change Requests
Question: What new change requests to the source code occurred during a certain period?
Overview
The Change Requests metric tracks the proposals for modifications to a project's source code that have been submitted for review during a given time frame. These proposals are reviewed by other developers before the changes can be accepted into the project. The process involves feedback loops where the submitter may revise their proposal based on the reviewer’s suggestions. Examples include GitHub "Pull Requests", GitLab "Merge Requests", and Gerrit "code reviews" or in some contexts "Changesets".
Tracking the number of change requests over time provides insight into the overall coding activity within a project. While this metric alone cannot measure the quality of the changes, it gives a good indication of how frequently contributors are engaging with the codebase.
Want to Know More?
Data Collection Strategies
- GitHub:
A change request is defined as a "pull request" when it proposes changes to source code files. The date of submission marks the beginning of the review process. - GitLab:
A change request is defined as a "merge request" when it proposes changes to source code files. The submission date is used to define the start of the review process. - Gerrit:
In Gerrit, change requests are referred to as "code reviews" or "changesets." The submission of a patchset marks the beginning of the review process.
Filters
- By period of time: Start and finish dates of the period under observation.
- By source code type: Narrow down change requests based on the type of source code being modified.
- By actors: Include filters based on the submitter, reviewer, or merger of the change request. Requires actor merging (merging ids corresponding to the same author).
- By groups of actors (employer, gender... for each of the actors). Requires actor grouping, and likely, actor merging.
- By status: Filter by the status of the change request (e.g., open or closed).
Visualizations
- Count per month over time:
Displays the number of change requests submitted each month in a bar chart format. - Count per group over time:
Shows change requests broken down by groups (such as organizations) over a specified period.
These could be represented as bar charts, with time running in the X axis. Each bar would represent change requests to change the code during a certain period (eg, a month).
-
Grimoirelab provides this metric out of the box for GitHub Pull Requests, GitLab Merge Requests, and Gerrit Changesets.
-
View an example on the CHAOSS instance of Bitergia Analytics.
-
Download and import a ready-to-go dashboard containing examples for this metric visualization based on GitHub Pull Requests data from the GrimoireLab Sigils panel collection.
- Example screenshot:
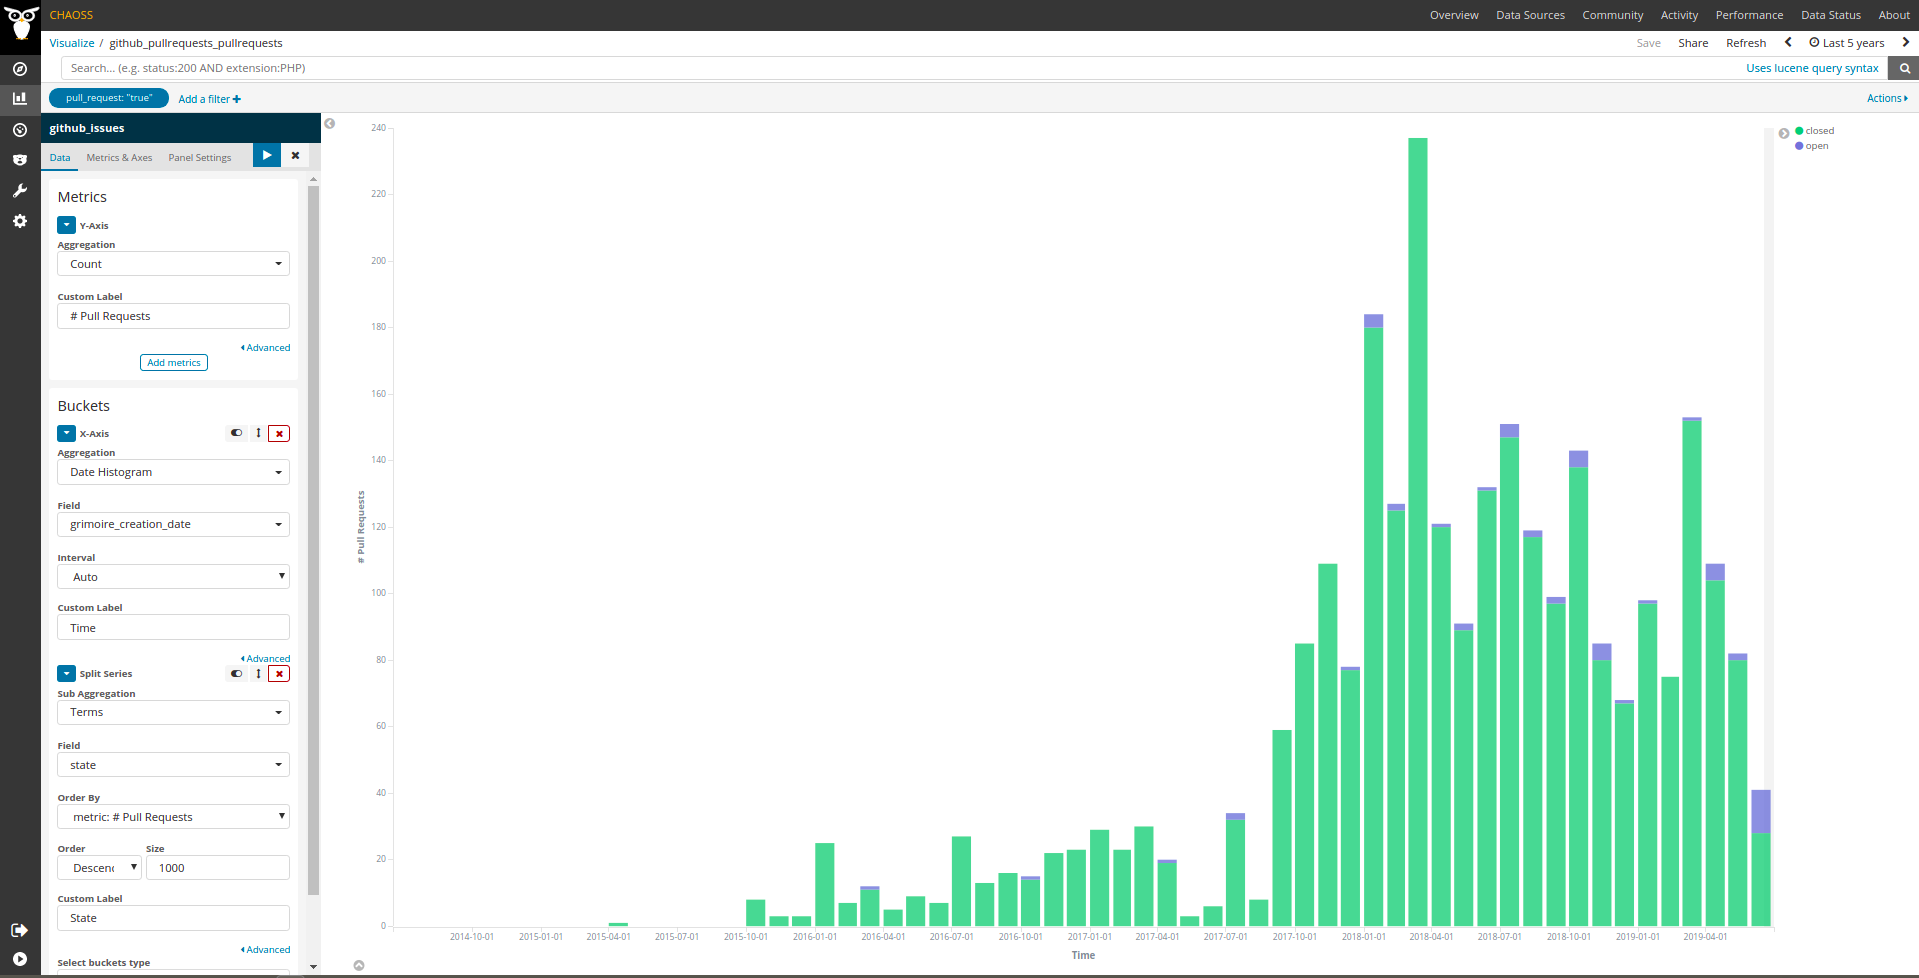 Figure 1: GrimoireLab screenshot of metric Reviews (Grimoirelab)
 -
References
- None Specified
Contributors
- None Specified
Additional Information
- To edit this metric please submit a Change Request here.
- To reference this metric in software or publications, please use this stable URL: https://chaoss.community/?p=3610.
The usage and dissemination of health metrics may lead to privacy violations. Organizations may be exposed to risks. These risks may flow from compliance with the GDPR in the EU, with state law in the US, or with other laws. There may also be contractual risks flowing from terms of service for data providers such as GitHub and GitLab. The usage of metrics must be examined for risk and potential data ethics problems. Please see CHAOSS Data Ethics document for additional guidance.