
Contributor Absence Factor
Question: How high is the risk to a project should the most active people leave?
Overview
The Contributor Absence Factor assesses the degree to which a project relies on a small number of contributors by identifying the smallest number of contributors responsible for 50% of total contributions. A lower Contributor Absence Factor indicates higher dependency on fewer contributors, posing a risk if these individuals leave the project. This metric helps project maintainers evaluate resilience and continuity risks associated with contributor reliance. This metric was previously called "Bus Factor."
Want to Know More?
Data Collection Strategies
- Types of Contributions: Calculate the Contributor Absence Factor for various types of contributions, such as commits, issues, comments, or documentation, depending on project needs.
- Formula: The formula for Contributor Absence Factor is a percentage calculation -50% will be our threshold- followed by adding up each contributor's contributions sorted in decreasing order until we reach the threshold.
If we have 8 contributors who each contribute the following number of contributions to a project: 1000, 202, 90, 33, 332, 343, 42, 433, then we can determine the Contributor Absence Factor by first identifying the 50% of total contributions for all the contributors.
Summary: 50% of total contributions = 1,237.5, so the Contributor Absence Factor is 2.
Full Solution:
- Arrange the data in descending order:
1000, 433, 343, 332, 202, 90, 42, 33 - Compute the 50% of the total:
(1,000 + 433 + 343 + 332 + 202 + 90 + 42 + 33) * 0.5 = 1,237.5
- Adding up the first two contributors in our ranking we get
1,433. - Answer: as
1,433 > 1,237.5, more than the 50% of contributions is performed by only2contributors, thus theContributor Absence Factor = 2.
Filters
- Time Period: Measure the factor at regular intervals to observe changes over time.
- Repository Group: For projects with multiple repositories, calculate the factor across relevant repositories for a comprehensive view.
Visualizations
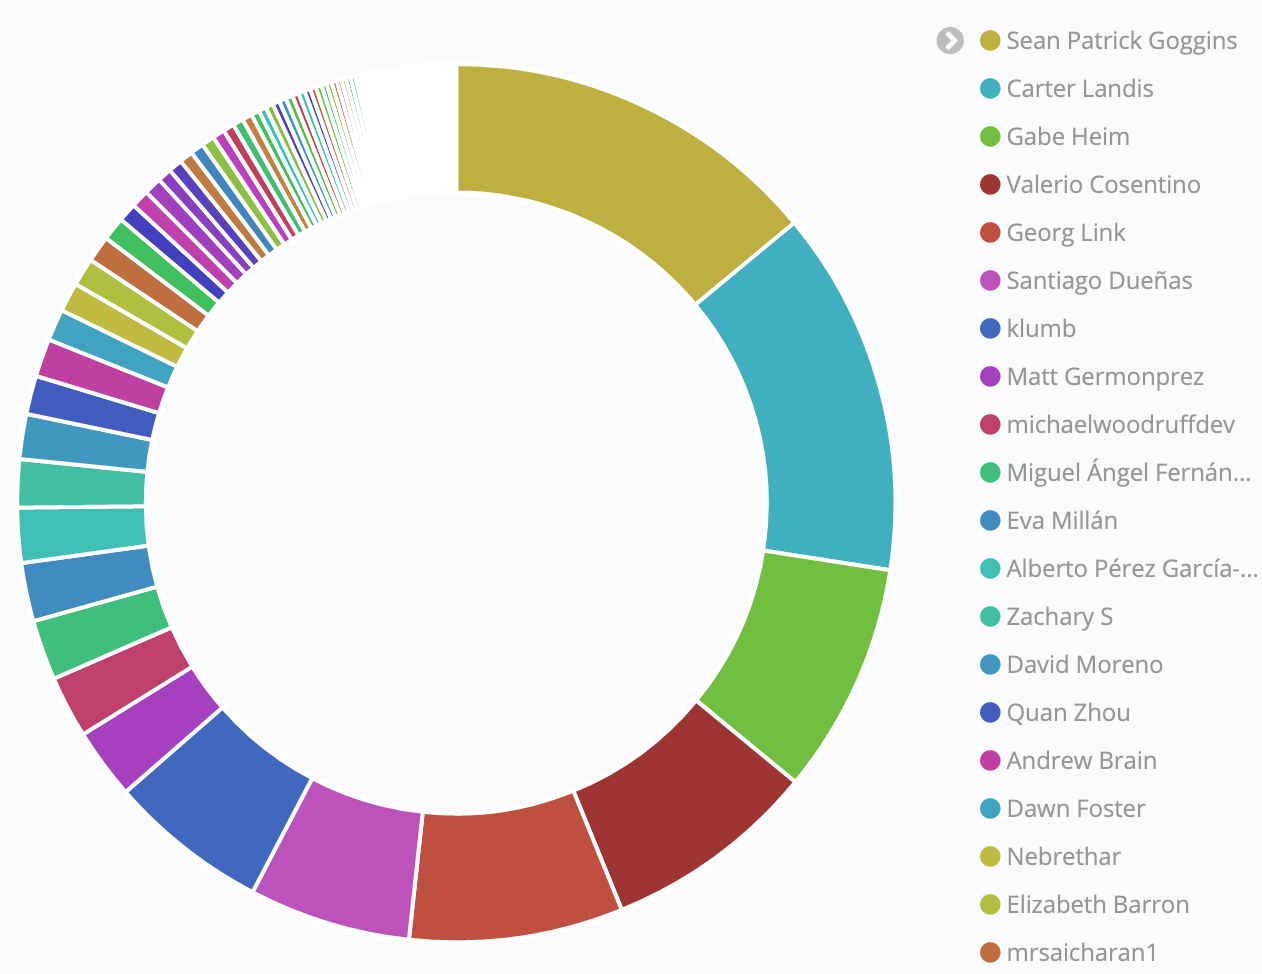
- Sample Visualization: Contributor Absence Factor for CHAOSS Project in 2020 based on git commits.
References
- None specified
Contributors
- CHAOSS Community Members
Additional Information
To edit this metric please submit a Change Request here.
To reference this metric in software or publications please use this stable URL: https://chaoss.community/?p=3944
The usage and dissemination of health metrics may lead to privacy violations. Organizations may be exposed to risks. These risks may flow from compliance with the GDPR in the EU, with state law in the US, or with other laws. There may also be contractual risks flowing from terms of service for data providers such as GitHub and GitLab. The usage of metrics must be examined for risk and potential data ethics problems. Please see CHAOSS Data Ethics document for additional guidance.